Correlative Electron and Light Microscopy, and dSTORM
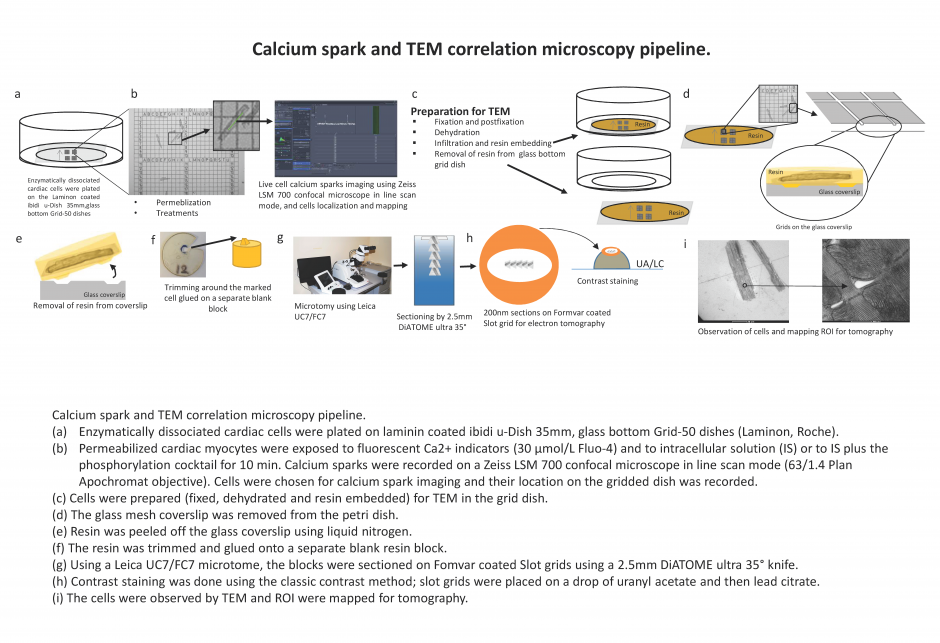
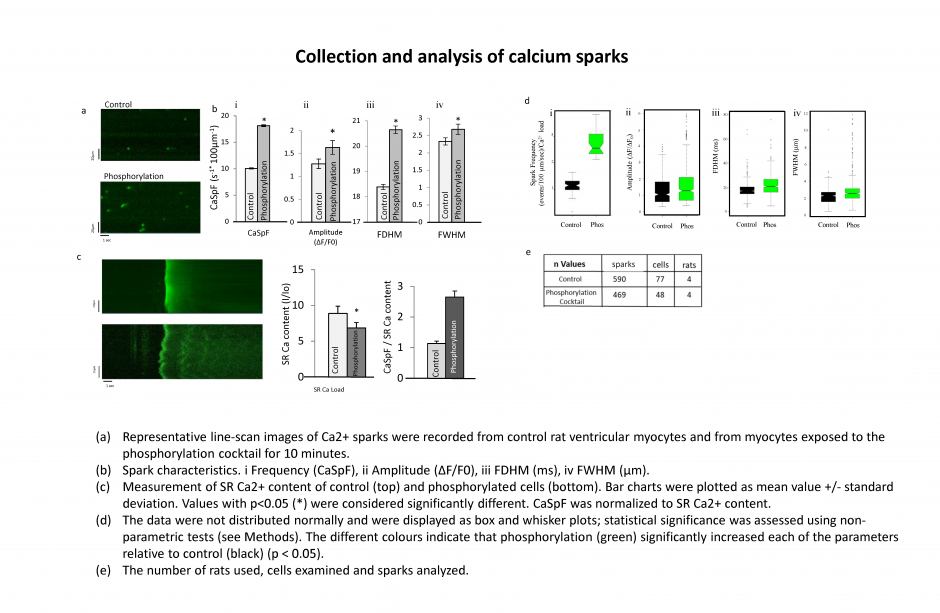
Localization and distribution of RyR2 on the surface of the SR in a normal rat ventricular myocyte assessed by dual tilt electron tomography.
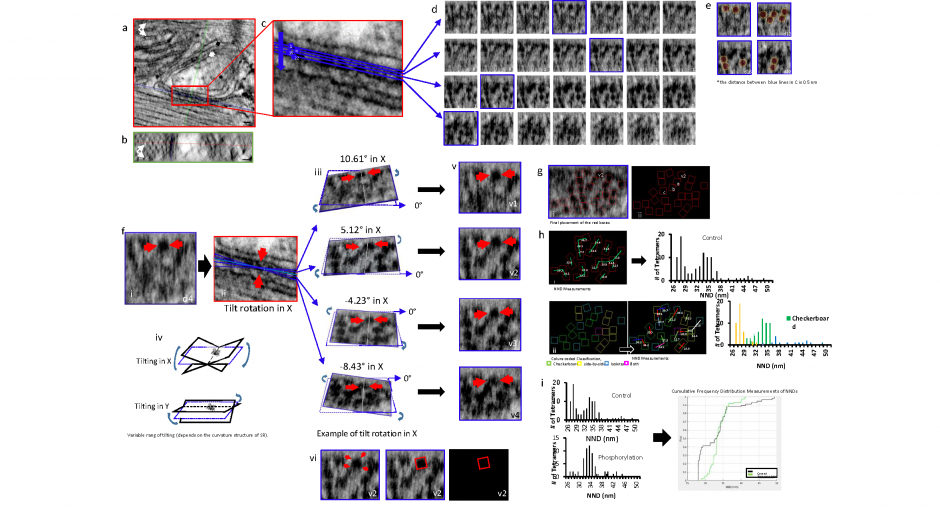
Localization and distribution of RyR2 on the surface of the SR in a normal rat ventricular myocyte assessed by dual tilt electron tomography. A single plane extracted from the dual-tilt tomogram of a normal cardiac myocyte with junctional sarcoplasmic reticulum (jSR) (arrows) adjacent to a t-tubule (double arrow).
Viewpoints within the volume of the tomogram were determined by the position of orthogonal planes that have been outlined in different colours; (a and c) XY in red, (b) YZ in green and (d1-d28) XZ in blue.
The intersection point of all three planes (blue, green and red) was positioned within a single ryanodine receptor in (a), (b) and (c).
(c) Enlarged view of the boxed area in a. RyR2 within the cleft were bisected and viewed en face. The curvature of the cleft requires multiple XZ planes to view all the RyR2.
(d) A segment of all of the XZ planes. Numbers increase moving from the surface of the t-tubule toward the jSR; the distance between planes was 0.5 nm.
(e) Four planes from panel d were highlighted in which 2 RyR2 in d4, 5 RyR2 in d12, 3 RyR2 in d16 and 2 RyR2 in d22, were seen most clearly.
(f) Identifying the orientation of the tetramer: i, A single RyR2 tetramer on d4 (red arrows are identified tetramer throughout the panel). ii, The XY and YZ planes were moved to the center of the tetramer and it was tilted in X and Y (iii and iv) until the four corners were clearly visualized. (v) Examples of how the tetramer changes appearance in response to tilting in X (vi) A tilt of 5.12° in X enabled the four corners of the tetramer (red arrows) to be clearly identified and it was covered with a red box corresponding to the tetramer’s size (27 nm2).
(g) The distribution and orientation of all of the tetramers in the junction displayed over a single XZ plane (i) and over a black background for clarity (ii). The tetramer positioned and oriented in f is highlighted (v2). Boxes ‘a’, ‘b’ and ‘c’ are the tetramers identified in Supplemental Figure 2 a, b and c, respectively.
(h) i, The center-to-center nearest-neighbour distances (NND) was calculated and displayed. Ii, A histogram of the NND obtained from 98 tetramers in 5 junctions examined in control myocytes. ii, The tetramers were sorted into the indicated categories. They, and a histogram of their NND, were redisplayed with a colour code; see Supplementary Methods.
(i) Histograms of the NND of control cells and cells exposed to the phosphorylation cocktail. The non-parametric k-sample Anderson-Darling test applied to determine the cumulative distribution of the pooled data. The samples arose from different populations (p < 0.01). Magnification: 29K. Scale bar 30 nm.
Using Amira software contour tracing, the 3D reconstructed dyads were converted to a 3D model.
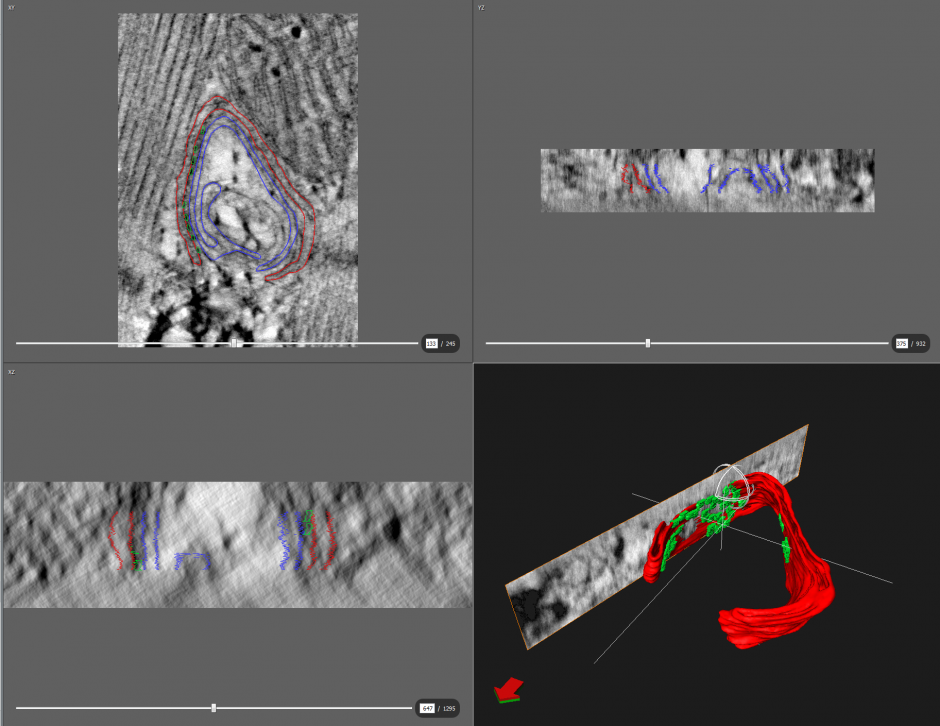
The final model of a normal rat ventricular myocytes dyad
Direct Stochastic Optical Reconstruction Microscopy (dSTORM)
Super-resolution imaging with dSTORM requires a system that allows the correct registration of upwards of 30000 images. Post-acquisition correction for drift is rarely sufficient for high accuracy. To solve this problem we collaborated with Keng Chou of the Dept. of Chemistry to create dynamic tracking for our home-built dSTORM system. This gave us a highly stable acquisition system with delta x and y < 0.6 nm and delta Z < 2 nm over periods of up to 40 minutes. In addition, the system collects blinks over a region of 50 x 50 um, much greater than the 18 x 18 um of most commercial systems.
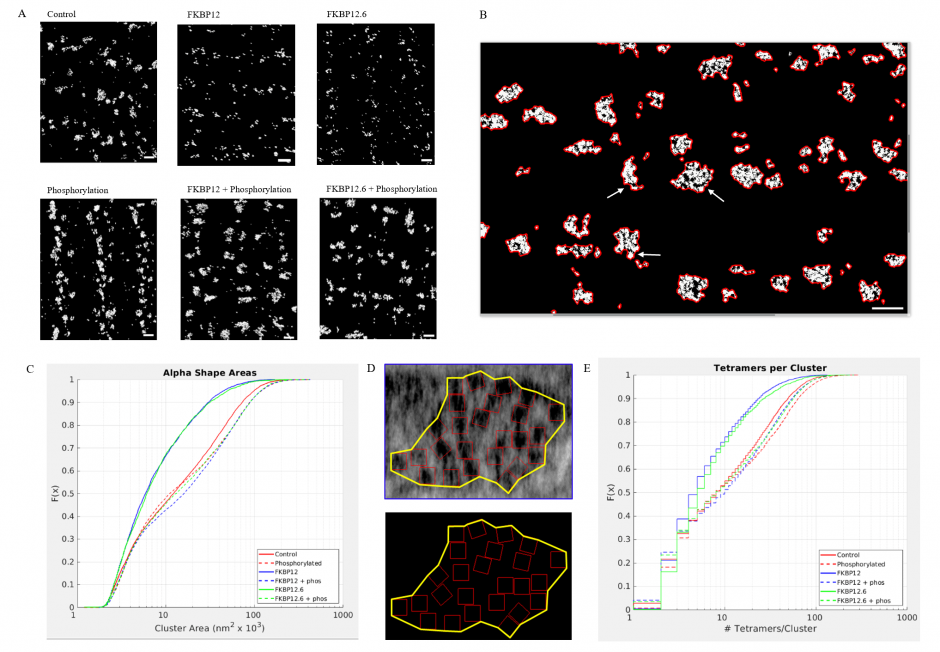
(A) Superresolution images of the surface of isolated cardiomyocytes labelled for the ryanodine receptor under the indicated conditions. Scale bars are 500 nm. (B) Alpha shapes identify individual clusters. Arrows point to examples of subgroups within a cluster. The scale bar is 500 nm. (C) Cumulative distribution functions of the RyR2 cluster sizes. Each treatment group is associated with a different colour. (D) The alpha shape is drawn around a tetramer array, the tomographic images are from a control myocyte. (E) Cumulative distribution functions of the number of RyR2 within a cluster under the different experimental conditions. Full statistics and the Matlab code are available at https://elifesciences.org/articles/51602